
What Site Care Looks Like When It Is Measured: Ten Sites to 90+ in One Afternoon
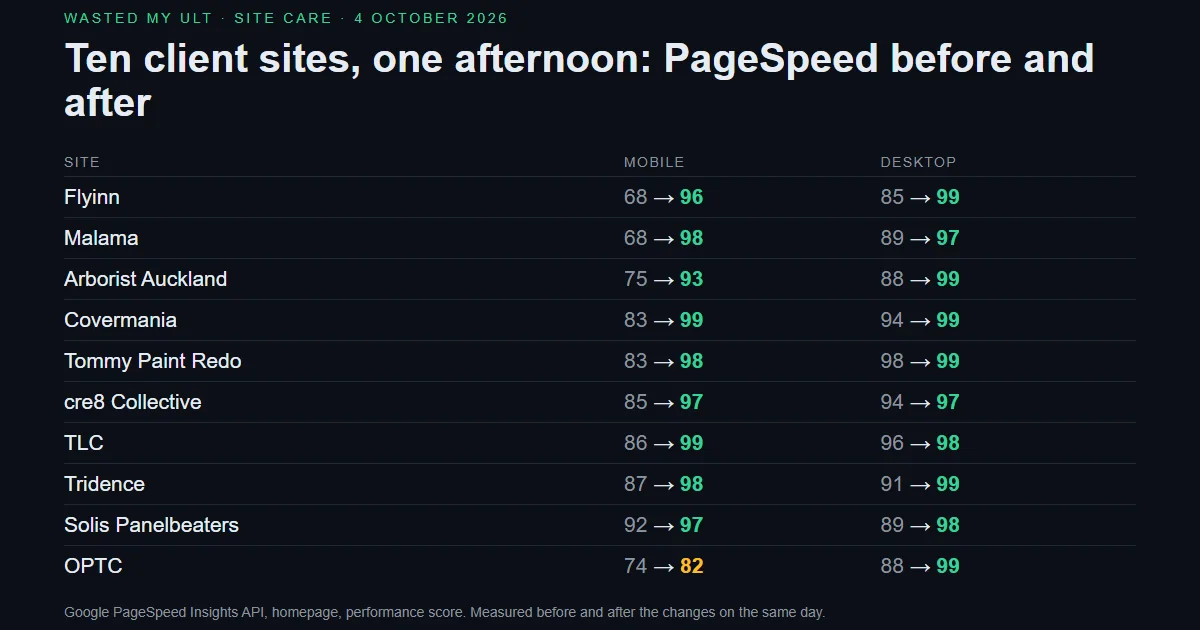
On 4 October 2026 we ran every client site through Google’s PageSpeed API, fixed what the numbers pointed at, and ran it again. The before-and-after table is the case study.
10
Client sites re-measured and fixed
93 to 99
Mobile PageSpeed after (nine of ten)
1
Afternoon, 4 October 2026
> THE PROBLEM
Every site we build ships fast. Then it lives: analytics tags get added, photos get uploaded at full size, a plugin update changes how a page loads, a hero animation that looked great in review turns out to hold the page blank until the JavaScript arrives on a phone.
We check the fleet monthly. On 4 October 2026 the check showed ten sites under 90 on mobile that had all launched above it. None of the owners had noticed; the sites looked fine on an office connection. Google notices, and so does a customer on a phone in a car park.
The usual answer is a vague "performance review" and an invoice. We wanted the number before, the number after, and the cause of each gap in one sentence.
> WHAT WE BUILT
We pulled Google’s PageSpeed Insights API for every client homepage, mobile and desktop, and read what each report pointed at rather than guessing. Five patterns covered almost everything: hero text animated in from invisible so the biggest element waited for the JavaScript; Google Fonts loaded from a third party in front of the first paint; analytics and session-recording scripts fighting the hero image for the first seconds of a phone connection; a 230 KB logo where a 21 KB one would do; and one e-commerce homepage running five database queries on every visit.
Each fix was small and specific. Hero entrances became CSS animations that paint on the first frame. Fonts were self-hosted. Analytics moved to load after the page is idle. Images were resized to what is actually displayed. The e-commerce homepage caches its data for ten minutes and renders its hero on the server. Every change was deployed and re-measured the same afternoon.
Two sites were left alone on purpose: one whose live domain still points at an old site awaiting the client’s go-live, and one where the remaining fix needs the client’s approval because it touches how their analytics loads. Site care is knowing where the line is as much as moving the number.
TECH STACK:
> THE RESULTS
- Flyinn: mobile 68 to 96, desktop 85 to 99
- Malama Birth and Being: mobile 68 to 98, desktop 89 to 97
- Arborist Auckland: mobile 75 to 93, desktop 88 to 99
- Covermania: mobile 83 to 99, desktop 94 to 99
- Tommy Paint Redo: mobile 83 to 98, desktop 98 to 99
- cre8 Collective: mobile 85 to 97, desktop 94 to 97
- TLC: mobile 86 to 99, desktop 96 to 98
- Tridence: mobile 87 to 98, desktop 91 to 99
- Solis Panelbeaters: mobile 92 to 97, desktop 89 to 98
- OPTC (e-commerce, 2,600 products): mobile 74 to 82, desktop 88 to 99; the rest is a server in another country
Measured with Google’s own API, before and after, same day. No agency screenshots. The scores are from the PageSpeed Insights API, the same numbers Google shows anyone who looks a site up, and the fleet is re-checked every month as part of site care.
> QUESTIONS THIS PROJECT ANSWERS
> MORE CASE STUDIES
CRE8 Collective
Four Brands, One Platform: Merging a People-Specialist Collective Without Fragmenting It
READ CASE STUDY Tourism / AviationFlyinn
When a Slow WordPress Site Is Costing You Bookings: A Photography-First Rebuild
READ CASE STUDY Content / PhilosophyLiving Pantheism
Designing a Website People Actually Read: Content Architecture for Organic Discovery
READ CASE STUDY> GOT A SIMILAR PROBLEM?
Tell us what's broken, slow, or missing. We'll scope it and send you a fixed quote.
Websites from $5,000 NZD. Platforms priced on scope.
> INITIATE CONTACT
Ready to start your quest? Send us a message!